
 Share this
Rice Markets Dynamics
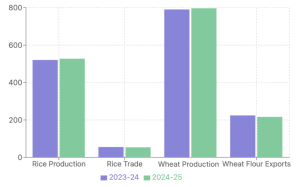
The global rice market in 2024-25 presents an intriguing paradox of increased production alongside decreased trade. Key figures include:
- Global production: 527.32 million tonnes (mt), up from 520.65 mt
- Global trade: 54.02 mt, down from 55.49 mt
- Trade-to-production ratio: 10.2%, down from 10.7%
India stands out with a forecasted record production of 139 mt, highlighting its growing importance in the global rice market. However, this surge in production is counterbalanced by declining trends in other regions. Countries like Bangladesh, Ghana, and Nigeria are experiencing production declines, while Bangladesh, Cambodia, Senegal, and Iran are seeing reductions in ending stocks.
The inverse relationship between increased production and decreased trade trends suggest potential shifts in domestic consumption patterns and the possible implementation of protectionist trade policies. India's record production raises questions about its export capacity and global market impact, particularly post-January 2025. The declining stocks in key markets indicate potential supply tightness, which may catalyze increased trade activity in the future.

Wheat Market Analysis
The wheat market shows similar trends of increased production and decreased trade. Notable statistics include:
- Global production: 796.88 mt, up from 790.54 mt
- Wheat flour and products exports: 216.50 mt, down from 224.37 mt
- Export-to-production ratio: 27.2%, down from 28.4%
Import trends vary significantly across regions. Major consumers like China, Egypt, and Indonesia are collectively reducing imports by 12 mt. The EU, Algeria, and Turkey are also showing significant reductions. Conversely, countries like Morocco, the Philippines, and Bangladesh are increasing their imports.
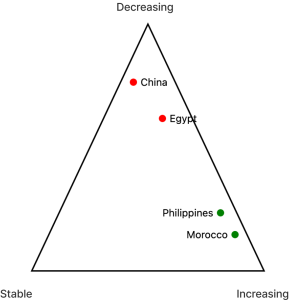
These market dynamics suggest increased domestic self-sufficiency in major importing nations and potential shifts in global dietary patterns or economic conditions. The reduced imports by major consumers like China and the EU warrant closer examination of changes in domestic agricultural policies, potential economic slowdowns affecting demand, and developments in alternative grain markets.
Comparative Analysis: Rice vs. Wheat
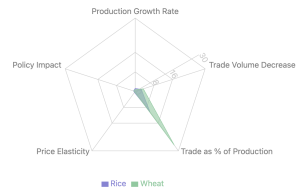
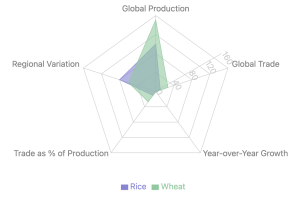
Both rice and wheat markets show production increases, but with differing trade dynamics:
- Production growth: Rice 1.28% vs. Wheat 0.80% (year-over-year)
- Trade volume decrease: Rice 2.65% vs. Wheat flour and products 3.51%
- Trade-to-production ratio: Rice 10.2% vs. Wheat 27.2%
This disparity highlights the different market structures and trade dynamics of these two crucial grains.
Conclusion: Market Outlook and Strategic Considerations
The 2024-25 projections for global rice and wheat markets present a complex scenario of production increases juxtaposed against trade volume reductions. This paradox necessitates a multifaceted approach to market analysis, considering factors such as:
- Geopolitical influences on trade policies
- Climate change impacts on regional production
- Evolving consumer preferences
- Technological advancements in agriculture
For market participants, these projections underscore the need for diversified sourcing strategies, enhanced focus on domestic market dynamics in key producing and consuming nations, and continual reassessment of supply chain resilience. As global grain markets navigate these challenges, the ability to synthesize diverse data points and adapt to emerging trends will be crucial for stakeholders across the agricultural value chain.